When we talk about SaaS products, we are talking about a recurring payment business model. That is, we have an object for which no single payment is made, but rather monthly, quarterly, or product-specific amounts are contributed to make use of its functionalities. It is therefore important to have SaaS metrics to monitor this.
Therefore, we are talking about a special type of business, online business, which does not carry the metrics that have always been used in conventional businesses.
In conventional models, most of the time data such as getting a client or preventing a client from leaving was not so important. In SaaS products, it is vital since we need a client to have a long life in our business to start making a profit.
5 key metrics for SaaS businesses
Below, we will leave you with the metrics that we consider most important to use in your SaaS business. Throughout the life of your business, we consider of vital importance to be handling as much data as possible, since they will help to have a reliable vision of what is happening in your company, beyond the merely palpable of the day to day.
This data will help you to optimize the operation of the company and make you see improvements where you probably did not think there were any. Each one of the following metrics will be aimed at a type of company and each one will have to know if it is in the right moment to make that metric.
Customer Acquisition Cost (CAC)
This data shows us the investment we have made for each new customer we have achieved. This statistic must be linked to the average purchase of the client since the value alone will not give us any results.
That is to say, if the CAC is 15 euros and the client spends 20 euros, perhaps we should optimize the CAC. But if our CAC is 10 times higher, that is to say, 200 euros, but our average client spending is 2,000 euros, we will already be having a great return on investment.

Within the costs, we must include advertising in traditional media, online, costs of the sales team, events, etc. We should not leave any expense that has been the marketing campaign itself.
LifeTime Value (LTV)
It is a ratio linked to the previous concept and could be defined as the net value of the income generated by a customer during his lifetime.
To calculate it we must take into account three other formulas and know that the formula will represent the data of the time ratio you choose (usually 1 year):
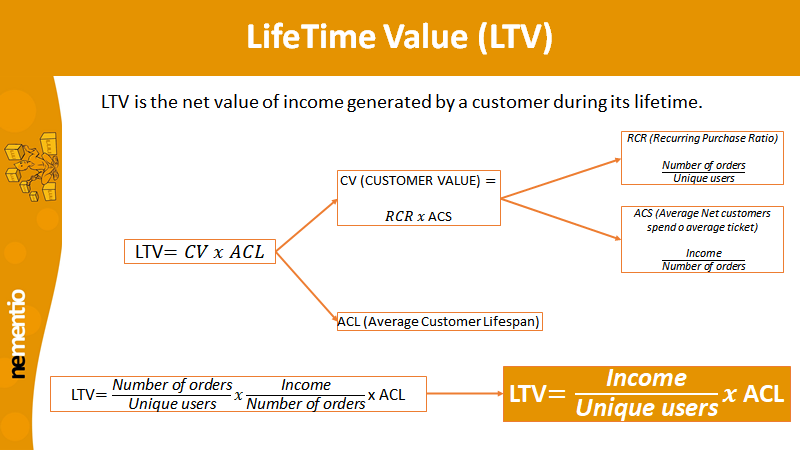
In the image above, we can see the breakdown of the formulas that make up the “LifeTime Value (LTV)”.
One of the most important data is the ACL, since depending on the data we enter, we can later compare it with the CAC. This data is usually calculated on an annual basis, so it will be 1.
The point of having broken down the formula is that, apart from making sense of it, data such as the RCR or ACS can give value to individual companies.
By measuring LTV against CAC, you can compare how long it takes to recoup the investment required to make money for new clients.
The LTV metric gives the revenue that a company can expect from each client and it is recommended to compare it with the CAC.
In other words, the CAC must be lower than the LTV, because if it is difficult to get a client more than you get him to spend in your company, you will get losses.
Monthly Recurring Revenue (MMR)
The key for a company is the income it obtains in a fixed, regular manner, which can be calculated quite accurately, and which gives the margin needed to continue with its day-to-day business. These “assured” sources of income make it possible to foresee expenses in the short/medium term.
Within this formula, there are a few “extras” that help us understand the variations of this over time. Let’s start with the normal representation of it.

To give more value to the formula, it can be broken down by different values, thus making a more intensive study of what your company’s monthly income is and even including in the case of SaaS such important data as the differentials in fees, both negative and positive, which can help a lot to analyze whether your fees/subscriptions are well adjusted.
- New MMR: New customers who have come to the application
- Expansion MMR: Customers who have improved their subscriptions
- Churned MMR: Customers who have left the application
- Downgrade MMR: Customers who have cut back on their subscriptions
All these data will be expressed in the currency in which each business operates. That is to say, the new MMR data will be for example 2,000 euros since we have had 200 new clients with 10 euros of subscription each.
Possible errors when calculating your MMR:
- Include payments of more than one month (such as annual payments), when the main idea is to serve as a snapshot of the moment to understand the business and forecast.
- Include test accounts or possible accounts within the calculation. This will make your account meaningless, as you will remove all meaning from some data.
- “Use MRR to learn from the past and prepare for the future”
Websites that offer a tool that will help you in the calculation of this ratio: https://www.billsby.com/resources/tools/monthly-recurring-revenue-calculator/
Anual Recurring Revenue (ARR)
Your company has been operating for several years now and you need an annual analysis, there is an MMR, but temporarily adjusted, ARR (Annual Recurrent revenue).
The formula is very similar to the MMR, but simply by counting it in one year.
ARR = Annual subscriptions + new customers and upgrades – losses by cancellations and downgrades
This formula is applied based on the “total income” of each figure. In the case of losses, the number of losses.
It is important to know the ARR since you will be able to follow the evolution of your SaaS a little more realistically by considering a greater number of data. This formula helps:
- To have tangible long-term numbers to make it easier to see how changes have affected us.
- Allows you to make predictions about future income.
- It creates a more realistic situation that allows for goal setting.
Churn Rate
For companies in the early stages, we do not find this ratio to be so important, as winning or losing as a percentage can be defined by small numbers, while for large companies it will be one of the most important ratios.
- Revenue Churn: It will tell us the percentage of income you lose each month. Also known as the MRO churn rate, it reflects the loss of revenue a company has as a result of decreased customers or subscriptions.
RC = (Revenue Churned in a period/Revenue at the beginning of a period) x 100
- Customer Churn: This ratio gives us the amount measured in the percentage of customers who stop subscribing to your products. This data will be very important as many companies need to calculate it given the high costs they have in acquiring customers.
CC = (Number of customers Churned in a period/Number of customers at the beginning of a period) x 100
Other relevant formulas
In this section, we will deal with two other metrics that are less linked to those that are pure financial data and that are more linked to consumer behaviour on their way through our application. In this case, we will see how important it is to know the rating or to obtain numerical feedback from consumers and also to know the behaviour of our client within our app.
Net Promoter Score (NPS)
The normal thing is that the metrics are linked to tangible data by the origin of the same business, we have already seen metrics of subscriptions, income, expenses … but currently, there is a very important metric, which is the one that reflects the customer’s opinion about our product.
In the early stages of your product, it is vitally important that you get this feedback with the consumer, as it will provide you with a lot of information to determine whether your product fits the market.
To measure this ratio, simply ask a question when you consume.
How likely is it that you will recommend our product to a friend?
A numerical evaluation will be made, imagine in this case from 1 to 10, where the possibility of recommendation or the answer to your question will be evaluated from highest to lowest.
We will consider good scores, those between 9-10, those 7-8 will be passive users and the rest will be negative scores.
Cart Abandonment Rate (CAR)
This situation brings headaches to e-commerce and can occur for many reasons. The main reason is usually because once we are determined to make the purchase will generate some extra costs that do not feel good to the customer, such as shipping costs or any other reason. On the other hand, we must also consider whether there is a technical problem that prevents the completion of the purchase.
CAR = (Visits with products in the cart without purchase/Total visits that have added at least one products to the car) x 100
Conclusions
As a conclusion, the following metrics are not made for all types of businesses and at any time. Each formula will be more suitable for businesses with a greater background and others for businesses that have recently entered the market.
If you want to grow you SaaS business, all of them will be able to help you at any time, but some will have more relevant data the longer you have been in the market and have more data. It is advisable that before you start doing all the metrics, you keep an accounting of your data and start doing it as soon as possible, even if it is in a simple Excel sheet.
If you have not yet started, we recommend that you start as soon as possible and hope that it will help you to optimize your platform.